
Recorded clicks week comparisons
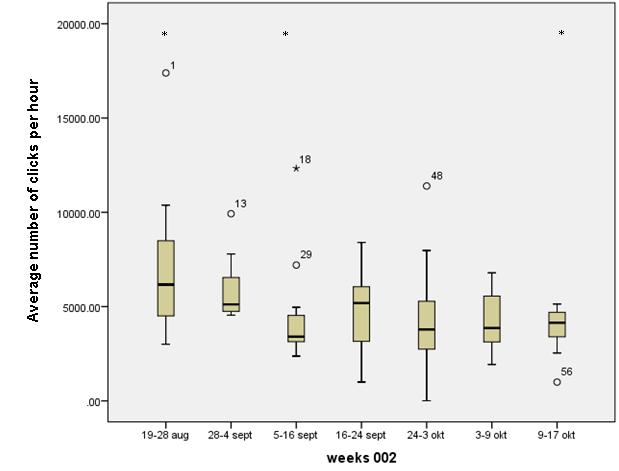
Between week one and three a significant decrease was found in emitted average number of clicks per hour (0.01 < P = 0.05), and between week one and seven (0.01 < P = 0.05) with a One-way ANOVA and post-hoc Tukey test. The emitted average number of click per hour recorded in week one was significantly higher than those in week three and seven.
The boxplot presented below shows the average number of clicks per hour recorded every day for seven weeks by PCL #002. The high outlier in the first week represents the average clicks per hour recorded during the first day after attaching the PCLs. On the 28th of August, plastic disks were attached to the CPODs, but this change does not seem to influence the recorded clicks per day.
Responsible for this page:
Director of undergraduate studies Biology
Last updated:
05/13/15