
Habituation process
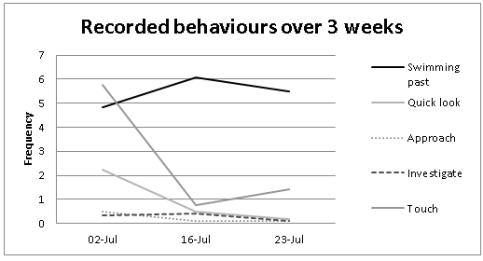
The behaviour recordings aimed at the CPODs during the first 3 weeks, from the 2nd of July 2014 to the 23rd of July 2014 can be seen in the graph displayed on the right. A clear decline can be seen in the behaviours ‘touch’ and ‘quick look’ between the first and second week.
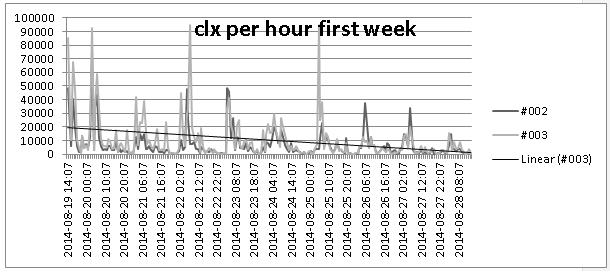
The graph displayed underneath shows the PCL recordings for the average number of clicks recorded per hour over the first week after introduction of PCL #002 and #003. The regression line indicates an overall decline in the average number of clicks recorded over time. Note that the regression line decreases from an average of 20.000 clicks per hour recorded during the first day to an average of 5000 recorded clicks on the last day of this week.
Responsible for this page:
Director of undergraduate studies Biology
Last updated:
05/13/15