
Results
Relative abundance
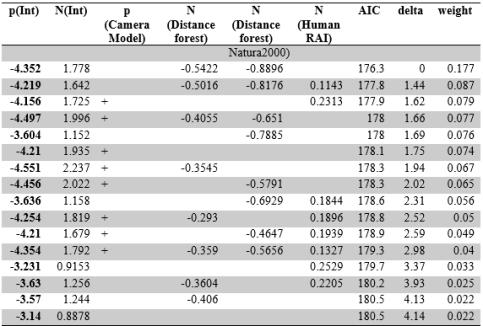
In the best applicable model, distance to forest (-0.5422, SE = 0.33475) and distance to Natura 2000 areas (-0.8896, SE = 0.5453) were both negatively correlated with the relative abundance estimates, showing that abundance is higher in areas inside and near forest and Natura 2000 areas.
Brown bear relative abundance was found to be comparably high in the areas of planned wind farm development.
Circadian activity
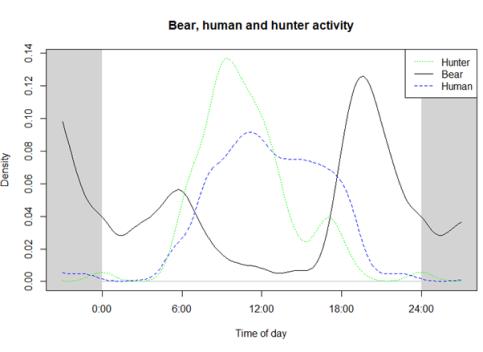
The observations (n = 64) of bears suggest that they show mostly crepuscular and nocturnal behaviour, reaching a peak after sunset. On the other hand, human events (n = 749) were captured mostly during the daytime and likewise, hunters (n = 15, included in the human events) were shown to be mostly diurnal with almost all of the observations during the day.
Habitat selection
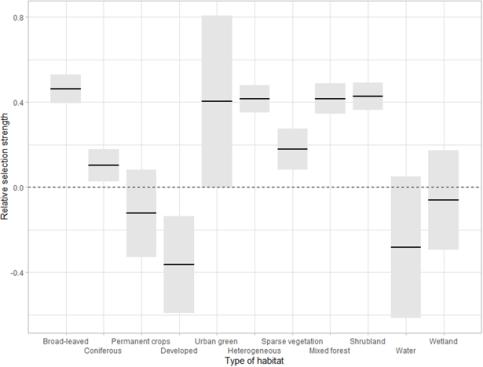
Bears showed a significant preference for areas further away from roads (p = < 0.001), areas closer to rivers (p = < 0.001) and closer to settlements (p = 0.006), but showed no significant preference for higher elevation. In addition, a significant preference was found for broad-leaved forests (p = < 0.001), mixed forests (p = < 0.001), heterogeneous agricultural areas (p = < 0.001) and shrublands (p = < 0.001) (Fig. 5).
Habitat suitability
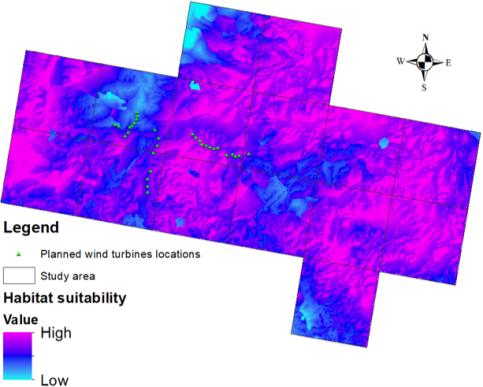
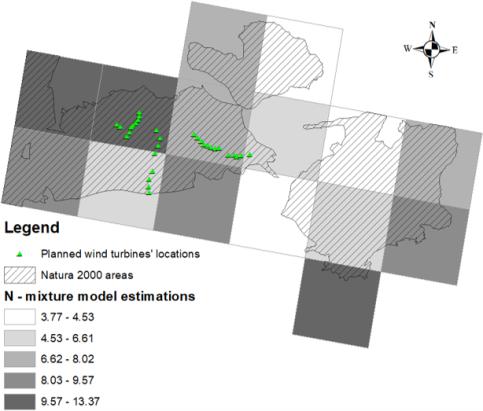
Following the habitat selection analysis, a brown bear habitat suitability map was created (Fig. 6) for the camera trapping study area and 22 out of 31 planned wind farms are located in areas with moderate to high suitability for brown bears.
Responsible for this page:
Director of undergraduate studies Biology
Last updated:
05/17/21