
Material & Methods
Model species
This study included ten game species. Like Lindström and Bergqvist’s (2020) model, red fox (Vulpes vulpes), Eurasian beaver (Castor fiber), wild boar (Sus scrofa), and European pine marten (Martes martes) was included as model species. These four species was included since they exemplify game harvest at high or low numbers and uniformly or variably across Sweden. In addition, six additional species for which landcover, climate variables, and geographical distribution were expected to have substantial impact was included. These six species are mountain hare (Lepus timidus), western capercaillie (Tetrao urogallus), rock ptarmigan (Lagopus muta), common eider (Somateria mollissima), American mink (Neovison vison), and greylag goose (Anser anser).
Data collection
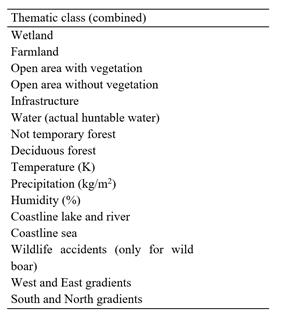
Each hunting year (July 1 to June 30), hunting teams are free to voluntarily report felled game through the database Viltdata, owned by SAHWM. In Sweden, there were 313 HMPs during the hunting year 2018/2019. Each HMP was linked to different covariates, which include landcover (deciduous forest, and not temporary forest, arable land, wetland, water area, and coastline), climate variables, wildlife accidents (only applies for wild boar), and geographical distribution (Table 1). The incorporations were performed using R with the GIStools-package (rgeos, rgdal, raster).
Model specification
A Hierarchical Bayesian framework estimates the posterior distribution parameters while allowing parameters to vary probabilistically, and it has become an important tool for many ecologists. For this study, the hierarchical model consists of multiple levels, where the available information (hunting teams that have reported felled game and area) is used for unobserved levels (hunting teams that have not reported felled game).
Previous model (Null model)
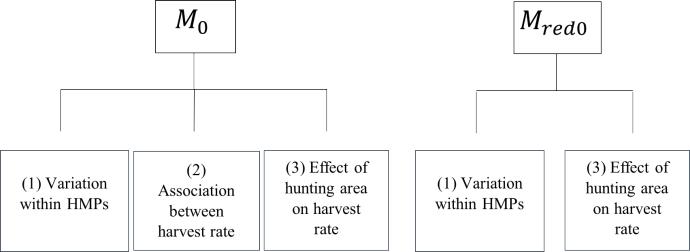
The former model (Lindström and Bergqvist’s model), which will henceforth be denoted as the null model accounts for (1) random variability among hunting teams, (2) association between harvest rate within hunting teams, and (3) the effect of hunting area on harvest rate (Figure 1). Lindström and Bergqvist’s result showed that the importance of (2) was dubious. Posterior estimates showed that when harvest rate was low, there was a greater variability between hunting teams in an HMP. Therefore, a reduced null model was also included in this study, where (2) association between harvest rate within hunting teams was excluded.
Proposed model (Covariate model)
This study was built on Lindström and Bergqvist's null model, where covariates at the hunting management precinct were added, creating the new covariate model.
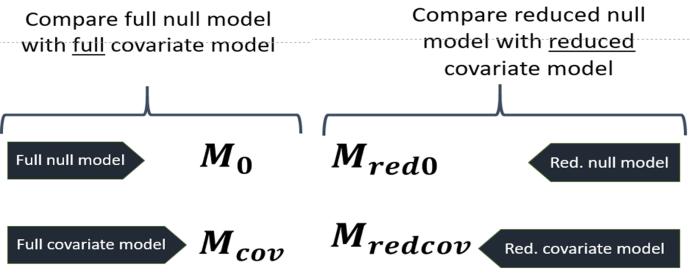
For this study, the full and reduced null model, which includes (1) within-HMP variation, and/or (2) association in hunting harvest within hunting teams in an HMP, and (3) the effect of hunting area on hunting rate was compared with the covariate model. The covariate model is the same as the null model; however, covariates are added to the model, creating as the full covariate model and as the reduced covariate model (excluding (2) association in hunting harvest within hunting teams in an HMP).
Model selection
This study performed two hypothesis testing: leave one out cross-validation (LOO-CV) and evaluation of the 95 % credible interval. LOO-CV was performed for model selection to evaluate predictive ability. Evaluation of the 95 % credible interval was performed by removing each covariate whose 95 % credible interval included zero, which implies that these covariates did not have an apparent effect on harvest estimate.
Computation
All analyses were performed with the programming language R, where all Bayesian modeling will be performed with Stan, using the R-package Rstan. The posterior distributions of the considered models do not have a standard form, and, therefore, numerical methods were required. One of the most frequently used numerical methods for Hierarchical Bayesian interference is Markov chain Monte Carlo (MCMC), where an MCMC simulation makes use of random sampling from a target distribution (in this, case the posterior).
Leave one out cross-validation (LOO-CV) is a statistical model for evaluating predictive ability, where one observation at a time (in this study, harvest per report) was excluded to later predict the remaining data of a model. Predictive performance was compared between models (in this study, the null model was compared to the covariate model). The comparison was performed through expected log-pointwise density (ELPD), which shows the relative predictive ability.
Responsible for this page:
Director of undergraduate studies Biology
Last updated:
05/22/21