
Results
Habitat preferences
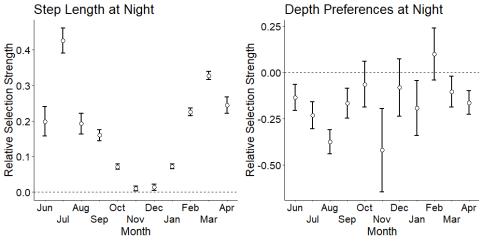
Wels catfish spent more time in the deep sections of Lillsjön than expected if depth selection was random. The only exception occurred in June, when the species preferred shallower areas. Lastly, wels catfish showed no preference for hardness of the lakebed as relative selection strength was small and almost equally distributed around zero.

Seasonal and diurnal variation in behavior
Wels catfish consistently took longer steps at night than during the day, especially between February and September. Wels catfish also tended to utilize shallower areas more during the night than during the day.
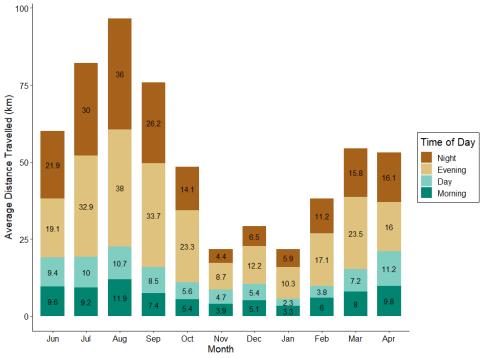
Wels catfish traveled longer distances during March to September compared with October to February, with activity being lowest in January. Additionally, average distance travelled was consistently higher during the night/evening than during the day/morning, further suggesting that wels catfish had a shifting activity pattern, with low and slightly nocturnal activity during winter, and high, distinctly nocturnal activity, during summer.
Site fidelity
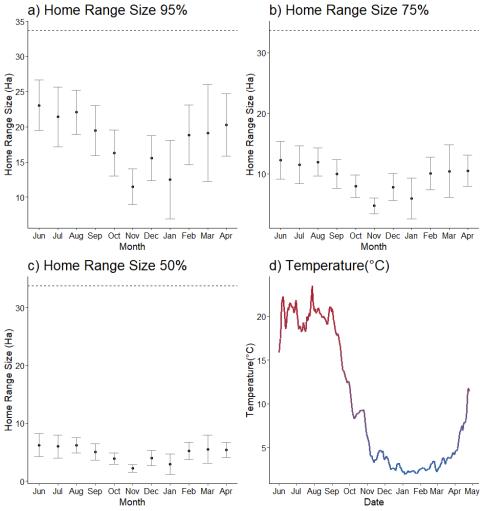
Wels catfish utilized smaller home areas during the colder months of the year, indicating high site fidelity during the winter. Home range size started to gradually increase in February before peaking in June- July, further implying that the activity of the species varied during the year. Interestingly, core home areas for each fish (50% AKDE) did not vary as much during the year as the 95% home range estimation. Indicating that wels catfish utilized small core areas during the entire year.
Responsible for this page:
Director of undergraduate studies Biology
Last updated:
05/13/21