
Results
The dogs took on average 18 trials to reach learning criterion (Min = 6; Max = 59; S.E. ± 0.714) with on average 30-40 minutes to complete the training and testing phase for each dog during the tCJB test and on average 10-15 mins during the nCJB test.
tCJB

Figure 4. tCJB latencies (in seconds) for each probe. Each latency did differ significantly from each other when running a Kruskall-Whallis test (〖χ²〗_((2)) = 143.81; P < 0.001). ** = significant to the P < 0.001 level.
- The latency was the fastest for the rewarded location, slowest for the unrewarded location and the ambiguous location withing both locations' latencies (X²(2) = 143.81; P < 0.001)
- GLM model 1 showed the bowl location did influence the latencies (X²(2) = 300.65; P < 0.001).
- None of the personality traits had an effect on the latencies
nCJB
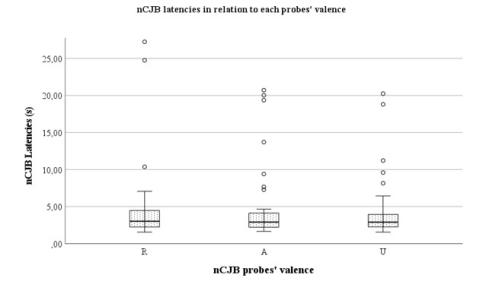
Figure 5. nCJB latencies (in seconds) for each probe (R, A, U). Each latency did not differ significantly from each other when running a Kruskall-Whallis test (〖χ²〗_((2)) = 0.55; P = 0.76).
- No difference in latency was detected between the 3 probes
- The valence did not incluence the latency but the personality trait Excitability did (X²(2) = 25.58; P < 0.001)
Behaviours
Only a few behaviours did influence the lateny to approach the valence in the nCJB:
- The amplitude side of approach
- The weight distribution
- Pulling the bowl
- The speed to approach
- Vocalization
tCJB & nCJb
The tCJB Cognitive Bias Score (Min = -0.03; Max = 1.61; Mean = 0.49; S.E. ± 0.11) and the nCJB CBS (Min = -3.00; Max = 37.85; Mean = 2.93; S.E. ± 2.00) were not correlated when testing for a possible link between the tCJB and nCJB CBS with a bivariate Spearman test (r = 0.11; P = 0.652).
Responsible for this page:
Director of undergraduate studies Biology
Last updated: