
Results
Larvae & vegetation mapping
In total, 484 larvae were found within 102 of the surveyed hectare grid cells. Within the focus areas (n=27 hectare grid cells), 219 larvae were found in the Core Area, eight in North Hejnum and 25 in South Hejnum. This resulted in a mean larval density/hectare of 896(±455SE) in the Core Area, 10(±14SE) in North Hejnum and 20(±34SE) in South Hejnum.
The best generelised linear model explained 35.97% of the variation in larval occurence within a circular plot. The top three variables showed that larval occurence increased with decreasing mean height of bushes and decreasing distance to host plant (Sedum album), as well as a squared relation to mosses/lichens cover with an optimum at 40-50%.
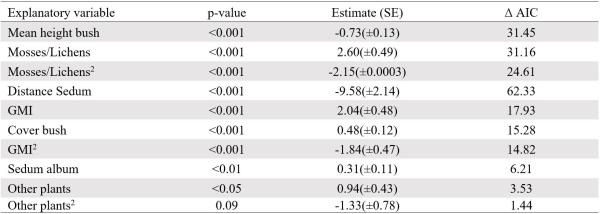
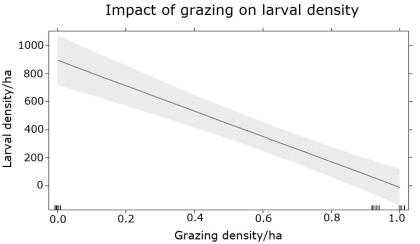
Further, when moving the analysis up one spatial scale from larvae preference in the small scale to habitat structures at the one-hectare scale, grazing had a strong negative effect on larval density, alone explaining 86.35% of the variation. However, the generelised linear model with the lowest AIC explained 88.15% of the variation in larval denisty. In this model larval density increased with increasing mosses/lichens cover as well as decreasing mean bush height, rock cover and host plant cover within 2m around a circular plot. Grazing density was omitted from the final model due to strong correlations to several other variables.
Capture-mark-recapture
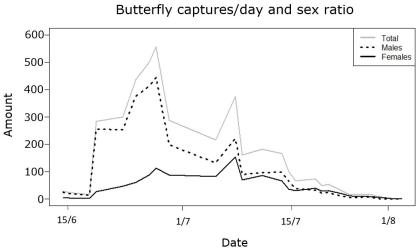
A total of 4518 individual butterflies were marked, of which 1132 were captured in the Core Area, 490 in North Hejnum and 262 in South Hejnum. Capture events ranged from 1-6 with a mean of 1.15 and the total recapture percentage was 10.29%. Total population size within the Filehajdar area was estimated to n=17063.
When assessing the adult butterfly habitat preference, butterfly density/ha within focus areas was used as dependent variable, and the generalised linear model with the lowest AIC explained 76.08% of the variation. This model showed increased butterfly density with decreasing forest cover and increasing abundance of flowering nectar plant species.
Nectar resource mapping
Within circular plots, 29 different species of flowering plants were recorded. Additionally a 30th category named ‘Other’ was added, in which species registered on less than five different occasions were accounted for. In the Core Area, 26 different species were recorded whereas 16 were recorded in North Hejnum and 25 in South Hejnum, including the category ‘Other’ in all areas. The mean number of species registered per circular plot were 2.56(±1.33SE) in the Core Area, 1.41(±0.89SE) in North Hejnum and 1.75(±1.13SE) in South Hejnum.
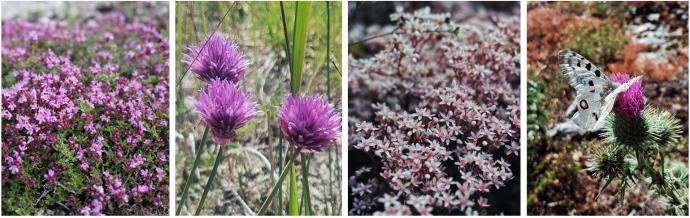
Within focus areas, a total of 150 events of nectar feeding were recorded and butterflies utilised nine out of the 30 species found in nectar resource mapping, including ‘Other’. The adult Apollo butterflies showed a trend towards significant preference to some nectar plants over others (p = 0.10). The three most utilised nectar plants in all were Thymus serpyllum: 27.4%, Allium spp: 23.1% and Sedum album: 14.8%. Further, the two nectar plant species that were utilised the most compared to their abundance were Allium spp (23.1% vs. 0.4%) and Cirsium vulgare (9.3% vs. 0.3%).
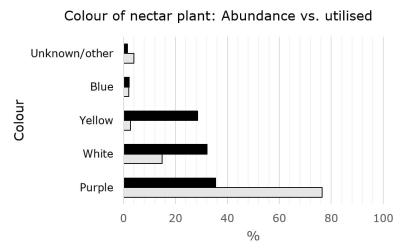
Based on colour of the nectar plant flower, the adult Apollo butterfly showed a significant preference in their choice (p < 0.01). The most preferred colour was purple, or pink, flowers which represented 76.5% of the utilised nectar plant species, whereas the recorded abundance of the same colour was 35.5%. The colour that the adult butterflies utilised the least compared to its abundance was yellow with 2.7% compared to the abundance of 28.6%.
Responsible for this page:
Director of undergraduate studies Biology
Last updated:
05/17/21