
Seasonal variation of pCO2 in Lake Erssjön

Lake Erssjön showed strong seasonal patterns in pCO2, where the pCO2 increased from a mean of 2090 ppm (SD=1049) between May to late July (period 1-4), to a mean of 5720 ppm (SD=1403) during mid to late August and early to mid-September (period 5 and 6) (the boxplots in the figure). Mean pCO2 was highest in early September (mean= 6469 ppm, SD= 1494). The pCO2 varied between days within a measurement period, but showed a larger variation and increase in pCO2 towards late July (the end within period 4) (the lines in the Figure).
Seasonal variation of CO2 flux in Lake Erssjön and Lake Följesjön
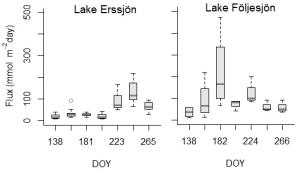
The same seasonal pattern was also seen in the CO2 flux in Lake Erssjön, where the measurements in mid-August to late September (measurement 5 to 7) showed markedly higher emissions (mean=111, SD= 52.5 mmol m-2 day-1), than the fluxes measured in the previous measurements (mean= 25,7, SD=16.9 mmol m-2 day-1). Lake Följesjön had constant high mean emissions throughout the season. There was a tendency for emitting more CO2 from June to August (mean= 126, SD=67.9 mmol m-2 day-1), than in May and September (mean= 50.6, SD=0.9 mmol m-2 day-1).
Responsible for this page:
Director of undergraduate studies Biology
Last updated:
05/20/15