
Growth of Rivularia during the experiment
Field observations on Rivularia
The Rivularia colonies varied in size between 0.5 and 4 mm in diameter. At all reference sites (Sites 1-4), Rivularia was abundant, covering between 2 and 50% of the stone surfaces. However, at the heated sites (Sites 5-8) Rivularia could not be found or was rare with only a few colonies per stone .
Microscopic observations on Rivularia
The micrographs of Rivularia showed healthy cyanobacterial cells and the amount of epiphytes (especially diatoms) varied, with generally less epiphytes in heated sites (Figure 5). Micrographs taken after the experimental incubation showed healthy cells in the 18°C treatment, irrespective of the copper treatment. In the 22 and 26°C the Rivularia cells were not in a good condition, irrespective of the copper treatment .
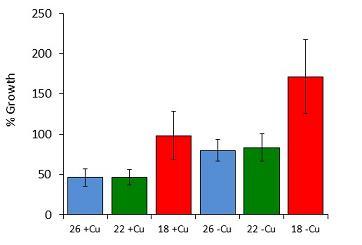
Biomass
Figure shows the difference in biomass, measured as g wet weight, between the start and the end of the experiment in %. In all treatments the wet weight of Rivularia increased during the 50 days of incubation. The highest growth (ca. 170%) was recorded in the reference treatment (no copper) at 18°C and the lowest growth (ca. 50%) was recorded in the copper treatments at 22 and 26°C. A two-way analysis of variance (ANOVA) with growth as response variable and temperature and copper treatment as prediction variables showed that both temperature and copper treatment had a significant negative effect on the growth of Rivularia (temperature p=0.000009, copper treatment p=0.000159). However, there was no significant combination effect (temperature*copper). This means that the effect of the copper treatment was the same in each of the three incubation temperatures 18, 22 and 26°C. A post-hoc Tukey test showed that there were no significant differences between the 22 and 26°C treatments, but that the 18°C treatment was different from the two higher temperatures.
Pigment dynamics of Rivularia in the experiment
The lowest chlorophyll a and the highest zeaxanthin concentrations in Rivularia were found in the 26°C treatment . This resulted in the highest carotenoids:chla ratio’s, indicating that Rivularia had mobilized its carotenoids defense against oxidative stress at 26°C, but not at 18 or 22°C. The effect was evident for both with and without copper, and showed that temperature caused this effect and not copper. These results were confirmed by 2-way ANOVA analyses too.
Photosynthesis of Rivularia
P-I cures were constructed for three samples from each treatment . The results showed very high variability and because of high standard deviations no differences occurred in photosynthetic rate between the treatments. However, when the sample with the best curve fit was selected, the Pmax (light-saturated photosynthetic rate) of the Rivularia was lowest in 26°C . Unfortunately, these results only show a weak indication without any statistical proof that photosynthetic activity would be lower in 26°C.
Multivariate analysis of community composition
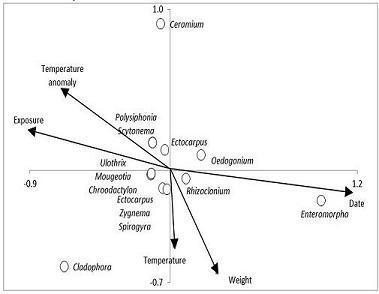
The principal component analysis (PCA ordination) shows that Cladophora on average responds positively (with higher weight) to temperature and Ceramium negatively (with lower weight ) and Ulva is more abundant in autumn and responds negatively to heating , while Ceramium responds positively to heating and exposure but was rare in the dataset . In Forsmark the temperature anomaly is strongly correlated with water flow. The algal biomass pointed in a direction opposite to the temperature anomaly, which shows that heating did not have a strong effect on the biomass in the most heated sites. Biomass seemed to be highest in stagnant and quiescent water and not in the sites that were heated the most.
Responsible for this page:
Director of undergraduate studies Biology
Last updated:
02/10/13