Hide menu

Results

Differences between sites

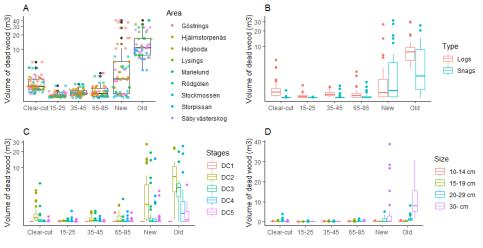
The highest amount of dead wood, and the highest variety of dead wood were found in nature reserves (new & old), while all production forests had a very low amount, and variety of dead wood. 

Diversity of dead wood in different types of forests. Data was log-transformed. New = Nature reserve, Old = old nature reserve. A). Total volume of dead wood. B). Volume of snags and logs. C). Volume of different decaying stages of dead wood. D). Volume of different sizes of dead wood.

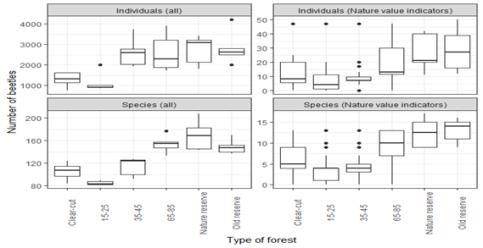
Nature reserves had the highest number of species and individuals, while production forests 15-25 years old had the lowest number. 

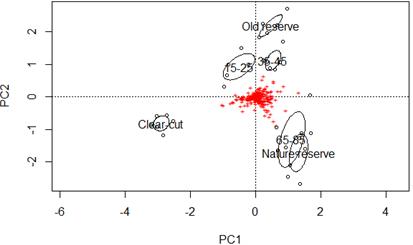
Clear-cuts had a different composition of saproxylic beetle species than other forest types. Species composition in production forests 65-85 years old had some similarities with composition of nature reserves. 

A PCA of saproxylic beetles in different forest types. Red plusses stand for species, and black or grey dots stand for composition of species in each site. PC1 explains 30% of the variation and PC2 explains 11% of the variation. Black circles are composition of species in a specific forest type

Ecological variables

Quantity and quality of dead wood, as well as canopy openness, had a positive correlation for number of individuals. Vegetation cover, basal area, and type of dead wood likely had a positive correlation with species richness and biomass. 


Correlation between dependent variables (biomass, species richness and number of individuals) and independent variables. Points represent T-value for biomass, and Z-value for species richness and number of individuals, from the GLM analysis. A point outside of the dotted lines represents a p-value <0.05, and a probable conjunction between the dependent variable and the independent variable.


Responsible for this page: Director of undergraduate studies Biology
Last updated: 05/14/21