
Results
From the 76 trees studied, a total of 21280 (mean=280.12, min=95, max=1005) saproxylic individuals were recorded and 254 (mean=46.01, min=32, max=62) species were found and identified (171 species were obligate and 82 were facultative). When removing singletons from the data before conducting multivariate analyses, I ended up with 201 species (mean=45.32, min=31, max=61). Out of these 201, 136 were obligate saproxylic species and 65 facultative species. 21280 (mean=279.3, min=94, max=1004) individuals were left when removing singletons.
Multivariate analysis
Using CCA, the results show more of an effect on species composition by Forest regrowth, Canopy cover and Trunk circumference than the other two variables which, as shown in Figure 3, had low impact in the model. The total level of explanation by our environmental parameters was shown to be 8.65 % (n=76, df=5).
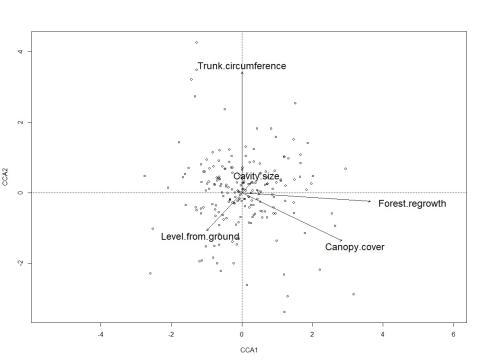
According to a permutation test based on the CCA for all species versus explanatory factors used in the study where terms were added sequentially (first to last), Trunk circumference (F=1.47, p=0.004) and Forest regrowth (F=1.41, p=0.008) were shown to have the highest impact on the data when removed or added to the model (999 permutations).
The CCA for obligate and facultative species separately showed Forest regrowth (F=1.37, p=0.023) to be the only significant explanatory variable investigating facultative species. Trunk circumference and Forest regrowth were found to be significant for obligate species (F=1.61, p=0.002 and F=1.39, p=0.018 respectively). For facultative and obligate species, this model explained 8.20 and 8.84 % respectively of the variation in beetle composition.
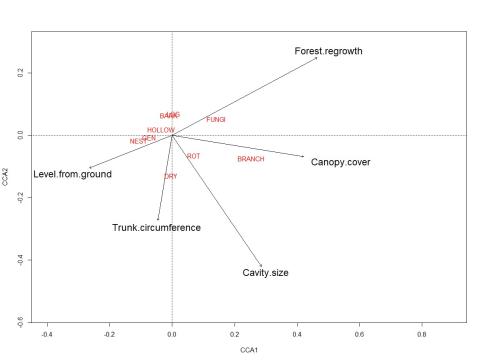
When dividing all species and individuals into the nine different guilds and running CCA tests for species and individuals separately I found that the explanatory factors explained 10.2 % (df=5) of the variation for species and 14 % (df=5) for individuals. No significant parameters were found on species level, closest was Forest regrowth (F=1.90, p=0.061). On individual level Trunk circumference (F=4.20, p=0.036) was the only significant variable.
Genreral flying activity
Investigating the correlation between the number of non-saproxylic individuals found and the number of saproxylic individuals found (including singletons), no significance was detected (t=-0.484, p=0.63). Same result was found when looking at individuals not living on oak versus number of saproxylic individuals (including singletons) (t=1.144, p=0.256). When investigating species diversity and the influence of the explanatory variables, no significance was found.
Red listed species
A total of 23 red listed species were found in the study (NT=17, VU=6) and the total amount of red listed individuals found were 491 (mean=6.46, SD=5.20). Number of red listed saproxylic species per tree ranged between 0 and 10 and the number of red listed individuals per tree ranged between 0 and 33. When analyzed with the explanatory variables, no significant variables were found for the number of red listed species or individuals.
Individual species
General linear models for all species were done and significant results are shown in the table below.
| Canopy cover | Cavity size | Level from ground | Trunk circumference | |||||
| Species | Estimate | p value | Estimate | p value | Estimate | p value | Estimate | p value |
| Aleochara stichai | 0,058 | NS | 0,000 | NS | 0,000 | NS | 0,006 | NS |
| Alosterna tabacicolor | 0,022 | NS | 0,000 | NS | -0,004 | 0,048 | 0,001 | NS |
| Ampedus cardinalis | -0,014 | NS | 0,000 | NS | -0,001 | NS | 0,007 | 0,015 |
| Ampedus hjorti | 0,069 | 0,014 | 0,000 | NS | -0,002 | NS | 0,010 | 0,002 |
| Anisotoma humeralis | -0,003 | NS | 0,000 | NS | -0,004 | 0,049 | 0,004 | NS |
| Anthrenus scrophulariae | 0,048 | NS | 0,000 | NS | 0,003 | NS | 0,005 | NS |
| Atheta crassicornis | -0,025 | NS | 0,000 | NS | -0,005 | 0,035 | 0,004 | NS |
| Attagenus pellio | -0,077 | 0,020 | 0,000 | NS | -0,002 | NS | -0,006 | NS |
| Aulonothroscus brevicollis | 0,026 | NS | 0,000 | NS | 0,003 | NS | 0,011 | 0,045 |
| Cortinicara gibbosa | 0,044 | NS | 0,000 | NS | -0,004 | 0,042 | -0,002 | NS |
| Dasytes aeratus | -0,066 | 0,013 | 0,000 | NS | 0,001 | NS | -0,001 | NS |
| Dasytes caeruleus | 0,018 | NS | 0,000 | NS | 0,000 | NS | -0,008 | 0,033 |
| Enicmus fungicola | 0,048 | NS | 0,000 | NS | -0,001 | NS | 0,008 | 0,023 |
| Enicmus rugosus | 0,027 | NS | 0,000 | NS | -0,004 | 0,023 | 0,000 | NS |
| Enicmus testaceus | 0,041 | NS | 0,000 | NS | -0,008 | 0,006 | 0,006 | NS |
| Epuraea guttata | -0,064 | 0,012 | 0,000 | NS | -0,002 | NS | 0,001 | NS |
| Euglenes oculatus | 0,041 | NS | 0,000 | 0,049 | 0,000 | NS | 0,005 | NS |
| Gastrallus immarginatus | -0,001 | NS | 0,000 | NS | 0,000 | NS | -0,007 | 0,009 |
| Globicornis nigripes | -0,062 | 0,018 | 0,000 | NS | -0,001 | NS | -0,003 | NS |
| Korynetes caeruleus | 0,004 | NS | 0,000 | NS | 0,000 | NS | 0,009 | 0,016 |
| Latridius hirtus | 0,037 | NS | 0,000 | NS | -0,002 | NS | 0,006 | NS |
| Lordithon lunulatus | 0,068 | 0,044 | 0,000 | NS | -0,005 | NS | 0,001 | NS |
| Lymexylon navale | 0,049 | NS | 0,000 | NS | 0,000 | NS | 0,003 | NS |
| Megatoma undata | -0,074 | 0,018 | 0,000 | NS | -0,002 | NS | 0,004 | NS |
| Mycetochara axillaris | -0,083 | 0,021 | 0,000 | NS | 0,002 | NS | 0,004 | NS |
| Mycetochara maura | 0,068 | 0,023 | 0,000 | NS | 0,001 | NS | 0,002 | NS |
| Orchesia micans | -0,009 | NS | 0,000 | NS | -0,001 | NS | -0,008 | 0,019 |
| Osmoderma eremita | 0,086 | NS | 0,000 | NS | 0,001 | NS | 0,000 | NS |
| Phloiotrya rufipes | 0,190 | 0,032 | 0,000 | NS | 0,006 | NS | 0,007 | NS |
| Protaetia marmorata | -0,027 | NS | 0,000 | NS | 0,003 | NS | -0,012 | 0,001 |
| Protaetia metallica | -0,053 | 0,038 | 0,000 | NS | 0,000 | NS | -0,005 | 0,042 |
| Ptinus fur | 0,069 | 0,042 | 0,000 | NS | -0,003 | NS | 0,006 | NS |
| Quedius dilatatus | -0,025 | NS | 0,000 | 0,014 | 0,002 | NS | 0,001 | NS |
| Quedius mesomelinus | 0,092 | NS | 0,000 | NS | -0,006 | 0,045 | -0,002 | NS |
| Quedius xanthopus | 0,091 | 0,044 | 0,000 | NS | 0,000 | NS | 0,003 | NS |
| Stictoleptura maculicornis | -0,003 | NS | 0,000 | NS | -0,001 | NS | -0,026 | 0,011 |
| Thamiaraea cinnamomea | -0,058 | 0,026 | 0,000 | NS | 0,001 | NS | 0,004 | NS |
| Trichoceble memnonia | 0,091 | 0,006 | 0,000 | NS | -0,001 | NS | 0,001 | NS |
Responsible for this page:
Director of undergraduate studies Biology
Last updated:
05/10/19