
Resuts
Comparing the visitor groups to the different behaviours showed that there was a significantly higher level of lying down, out of reach, standing petted, lying down petted, moving petted and walk away with more visitors. There was a significantly lower level of standing, moving, in reach and approach with more visitors.
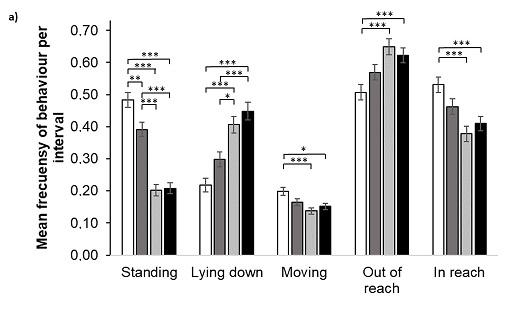
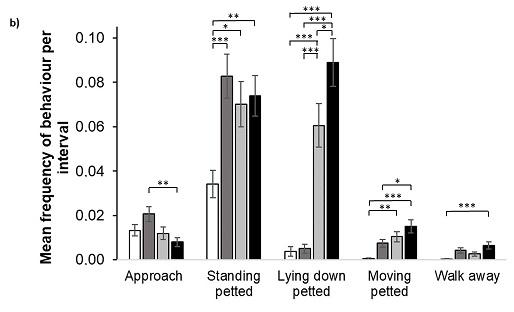
Graphs of the different mean frequency (±SE) of behaviours with significant results compared to the visitor groups where 1 (white) is the least number of visitors, 2 (dark grey), 3 (light grey) and 4 (black) is the highest number of visitors. a) Behaviours not directly connected to visitors and b) is behaviours connected to visitors. The two graphs have different y-axis scales. Significant shown with * ≤ 0.05; ** ≤ 0.01; and *** ≤ 0.001.
There was no significant difference between visitor groups for the behaviours retreat walk, retreat run, vocalise, aggressive animal and aggressive visitor.

Graph of the different mean frequency (±SE) of behaviours with non-significant results compared to the visitor groups where 1 (white) is the least number of visitors, 2 (dark grey), 3 (light grey) and 4 (black) is the highest number of visitors.
Responsible for this page:
Director of undergraduate studies Biology
Last updated:
05/17/18