
Study site & Method
Study site
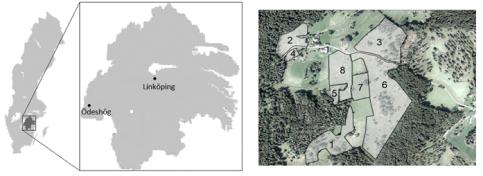
The farm Månsabola, located in Ödeshög, Östergötland, used as study site in this case study applies a form of rotational grazing with cattle, and was chosen based on being one of Östergötland’s most butterfly species rich semi-natural grasslands. The total studied area was ca 15 ha, and was made up by eight pastures: seven pastures that have been grazed for a long time, and one area that has been arable field, but that is now grazed. The eight grazed areas were temporarily divided into smaller parts as the animals were moved between pens.
Butterfly survey
Butterflies (Hesperioidea and Papilionoidea in the suborder Rhopalocera) and burnet moths (Zygaenidae) in the order Lepidoptera were surveyed in transects. There was a 10-meter distance between each transect, which were walked with a pace of 2 minutes per 100 meters. All butterflies within 5 meters to the sides and 5 meters ahead were identified to species, and their positions were marked with a GPS receiver. Unknown individuals that were not possible to catch for identification were categorized according to coloration and size to a species that, at the time, were common in the nearest area. The species Plebius argus and Plebius idas, and Leptidea reali and Leptidea sinapis are very difficult to distinguish from each other within the genera. They were therefore classified as P. argus/P. idas and L. reali/L. sinapis, respectively. The inventory was only made between 9.00 am and 4.30 pm, with wind below 8 m s−1, temperatures above 25º C if it was cloudy and above 17º C if it was sunny.
Habitat quality factors
The amount of nectar resources was estimated approximately once a week in grid points with 20 meters between each point. The estimation was done by measuring the diameter of nectar-giving flowers within 1x1 m squares, and converting the total area to permille of one square meter. Also, the percentages of the family Dipsacaceae and the genera Centaurea and Cirsium of the total nectar in the square were estimated.
By measuring the grass sward height, we get an estimation of the grazing intensity. The estimation was done at the same time and in the same plots as the nectar measuring. Sward height was measured with a graduated pole with a 30x30 cm board of a weight of 430 g. The board was gently placed on the grass and the height from the ground to the board was read on the pole.
Plant species richness was estimated once in mid-August as the presence of all nectar gicing herb species within 25 x 25 cm squares. This was one in the same gridpoints as for nectar and grass sward hegiht.
Cover of trees and shrubs was estimated with aerial photos.
Rotation of grazers
The time when the animals were moved between pens was recorded, as well as how many animals there were in each pen, and the border of the new pen was marked with GPS. The movement of the grazers was done based on how much grass there was for the animals to feed on. The number of grazers was calculated as one adult cow per one day, or 0.5 cows per one day if the cows were young.
Responsible for this page:
Director of undergraduate studies Biology
Last updated:
06/01/17