
What follows is a selection of the most relevant results of my thesis. I won't enter in details explaining the statistics behind them, but if anyone wants to know them, contact me and I will be glad to explain them. Also, I used R language for my statistical analysis, which code I will be also glad to provide if anyone is interested.
Hand preference comparison between tasks
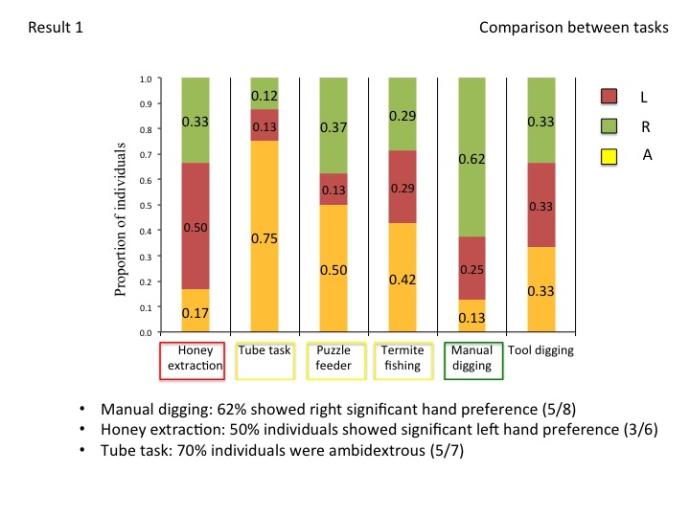
The first step for comparing tasks was to classify the each individual into a hand preference group according to its performance in each task. Each individual was clasify as showing significant left hand preference, significant right hand preference or no preference. Once this is done, it is possible to compare the different tasks in terms of the proportion of individuals classified in each of the groups.
Manual digging and honey extraction were the two tasks in which the highest proportion of individuals showed a significant hand preference (0.87 and 0.83 respectively), while the tube task yielded the lowest proportion of individuals that showed a significant hand preference (0.25) compared to the other tasks (Fig. 7). Manual digging was the task for which the highest proportion of subjects significantly preferred to use the right hand (0.62) while the opposite was found for honey extraction (0.50).
Consistency of Hand Preference Across Tasks
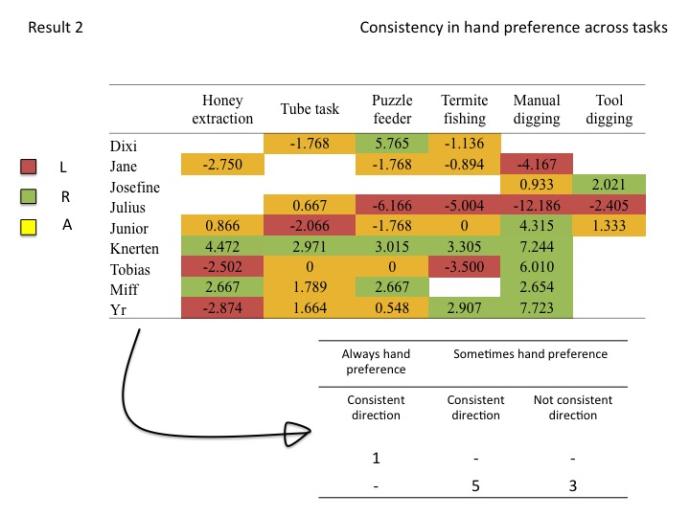
When the performance of each subject was studied separately across the 6 tasks, Knerten was the only one that showed consistency in hand preference across all the five tasks in which he participated. Dixi, Jane, Josefine, Julius, and Miff were found to show a significant hand preference only in certain tasks but they were consistent across tasks in which hand they preferred. In contrast, although Junior, Tobias, and Yr also only showed significant hand preferences in some tasks , they did not always prefer the same hand.
In other words, only one individual was completely consistent, five showed consistency in the preferred hand (left or right) but not always showed hand preference (for some tasks they were ambidextrous), and three individuals showed reversions on which hand they preferred (for some tasks they preferred the left, for some the right and for some they were ambdextrous).
Comparison of Hand Preferences between Sexes
Direction of Hand Preference
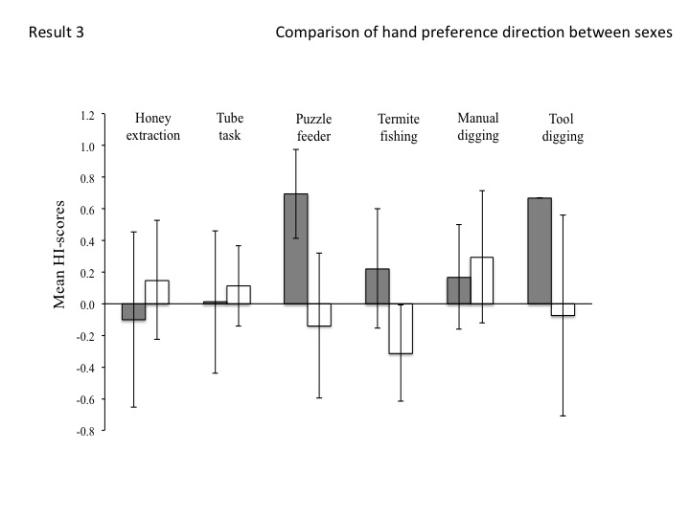
No significant sex differences in hand preference direction (left or right) were found for any of the tasks studied (honey extraction: NF = 3, NM =3, Z= -0.22, P =0.83; tube task: NF = 4, NM =4, Z= -0.29, P =0.77; puzzle feeder: NF = 3, NM =4, Z= 0.89, P =0.37; termite fishing: NF = 4, NM =4, Z= 1.15, P =0.25; manual digging: NF = 4, NM =4, Z= -0.58, P =0.56; tool digging: NF = 1, NM =2, Z= 1.22, P =0.22). Nevertheless, in 4 out of the 6 tasks, the average HI score of males and females was of different direction and only in the case of manual digging and the tube task, both males and females preferred to use on average the right hand. The HI score is a index that measures of how biased to the left or right the individual hand preferences are. This score is defined by [(number of right hand uses - number of left hand uses)/(total number of hand uses)]. Regarding the tasks where the direction of hand preference was different between sexes, males were biased to the right and females to the left in the puzzle feeder task, termite fishing task and tool digging. The honey extraction task was the only case in which males were biased to the left and females to the right.
Strength of Hand Preference
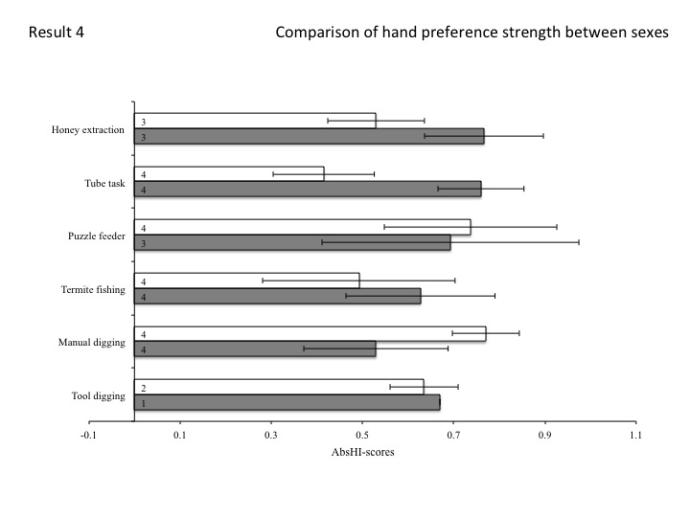
The strength of hand preference (represented by the absolute value of HI) did not differ significantly between males and females for any of the six tasks (honey extraction: NF = 3, NM =3, Z= 1.09, P =0.28; tube task: NF = 4, NM =4, Z= 1.74, P =0.08; puzzle feeder: NF = 3, NM =4, Z= -0.37, P =0.71; termite fishing: NF = 4, NM =4, W= 6, P =1; manual digging: NF = 4, NM =4, Z= -1.31, P =0.19; tool digging: NF = 1, NM =2, W= 1, P =0.67), although in the tube task the females' mean AbsHi-score was 0.32 units higher than the males' mean AbsHI-score. In four out of six tasks (honey extraction, tube task, termite fishing and tool digging), males showed stronger hand preferences than females. In contrast, in the puzzle feeder task and manual digging it was females that showed a stronger hand preference than the males.
Comparison between digging modalities (manual and tool digging)
Out of the 9 chimpanzees, 8 were recorded digging. Tobias was the only individual that dug manually but never used tools for digging, while the other 7 animals were recorded digging both manually and using tools during the 4 months of the study. The average duration of a digging bout (combining bouts of both digging modalitites) was 47.9 ± 37.5 seconds.
The manual digging bouts were significantly more frequent (95%) than the tool digging bouts (5%) (V = 36, P = 0.008), and all the 7 individuals that used both modalities dug more often manually than using tools. The mean duration of the manual digging bouts was 50.02 ± 3.44 s, while the mean duration of the tool use digging bouts was 48.08 ± 14.68 s. No significant correlation was found between the daily average of bouts and the daily duration of the digging activity (r = 0.16, P = 0.26).
The digging modality used did not significantly affect the duration of the digging bout (Nmanual=734, Ntool= 40, W = 15620, P =0.495). Nevertheless, when considered individually, all 7 chimpanzees that dug both manually and using tools, differed in the bout duration of the two digging modalities, and all of them dug longer manually than when using tools (N = 7, V = 28, p=0.016). Regarding sex differences, females dug significantly longer than the males both manually (Females = 58.67 ± 4.62 s, Males =43.44 ± 5.28, W = 77604, P = <<<0.01) and when using tools (Females = 90.31 ± 34.11 s, Males =19.92 ± 4.14, W = 290.5, P = <<<0.01).
Responsible for this page:
Director of undergraduate studies Biology
Last updated: