
Results
Summarizing table
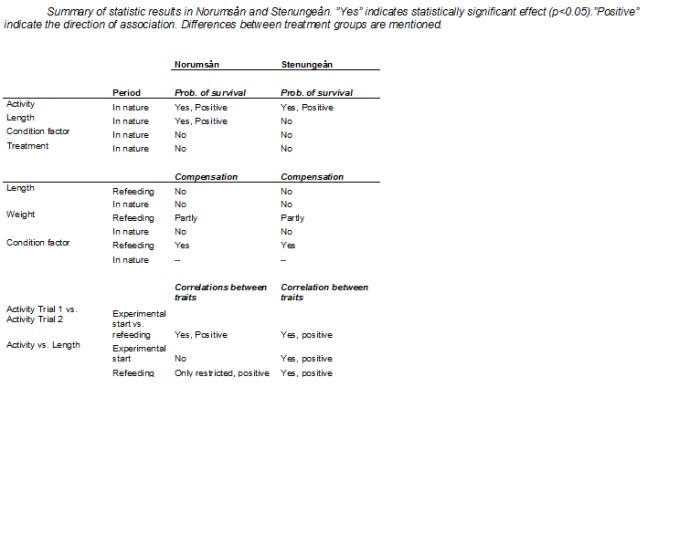
Recapture
In Norumsån, 40 out of 131 released fish (30%) survived the 36 day period in natural conditions. No statistically significant difference in re-capture frequency was found between the two treatment groups (28% and 33% from the Restricted and Control treatment, respectively, p>0.1).
In Stenungeån, 69 out of 139 (49.5 %) of the released fish were recaptured. Just as in Norumsån, no difference was detected in the re-capture frequency between the treatments (55% and 43% from the Restricted and Control treatment, respectively).
Activity and Body size
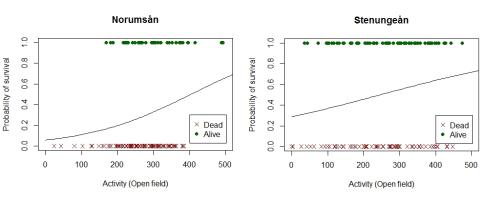
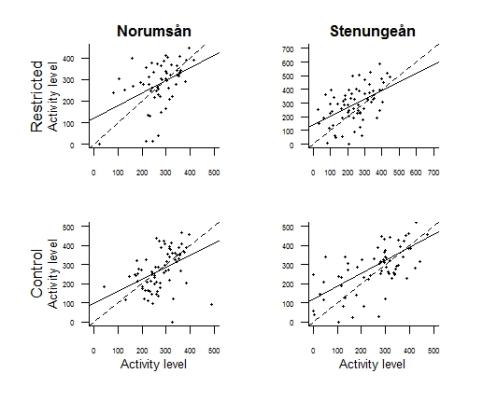
Activity (open field) was positively associated to the probability of survival under natural conditions in both Norumsån and Stenungeån (Figure 3). Significant repeatability in activity level was found in both treatment groups in both streams (Figure 4).
Standard length was positively associated with probability of survival in the stream in Norumsån but not in Stenungeån (Figure 5). Table 2 summarizes all statistical results.
In Stenungeån the overall activity level (both treatments included) increased over time in laboratory conditions (F1; 138 =18.21 p<0.0001). No change in activity level was found between the two trials in Norumsån.
There was no effect of treatment on change in activity level over time in any of the two stream populations (Norumsån: F1; 129 =0.64 ; p=0.42, Stenungeån: F1;138 =1.92, p=0.17).
Compensatory growth
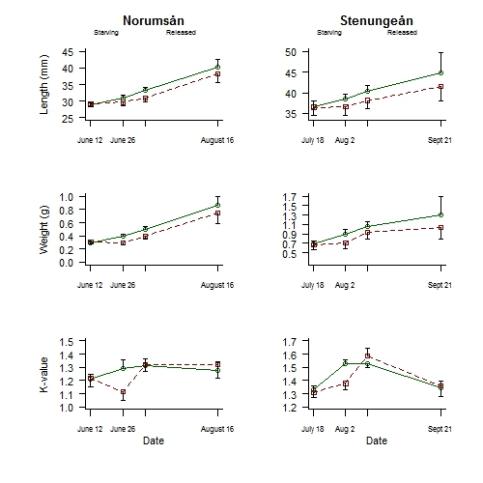
Body condition was fully recovered during the refeeding period in both the Norumsån-experiment (t=9.26, p<0.0001) and Stenungeån-experiment (t=11.01, p<0.0001) (Figure 6). During the periods in natural conditions no statistically significant difference in condition factor was found between treatment groups.
The specific growth rate in weight during the refeeding period was higher in the Restricted group than in the Control group in both Norumsån (t= -7.88, p<0.0001) and Stenungeån (t=-4.72, p=0.0004) (Figure 6). During the period in natural conditions no statistically significant effect of feeding treatment was found in specific growth rate for weight.
No compensatory growth in length was found during the refeeding period in any of the streams (Figure 6). During the periods in natural conditions no statistically significant effect of feeding treatment was found in specific growth rate in length.
Correlations between traits
Fish in the restricted group showed a positive association between activity level and specific growth rate in length during the refeeding period in both Norumsån (R2=0.19, p=0.0003) and Stenungeån (R2=0.10, p=0.004). This association was not found in the Control groups. The association was statistical significantly different between treatment groups in Norumsån (F=5.997, p=0.016) but not in Stenungeån (F=0.932, p=0.34) (Table 2).
Length and activity showed a weak positive association, both before experimental start (R2=0.08, p=0.0003) and during refeeding (R2=0.1, p=0.0002) in Stenungeån. In Norumsån such positive association was only found in the restricted group during refeeding (R2=0.32, p>0.0001) (Table 2).
There was no association between length and growth rate during any periods of the experiment.
Body condition was not associated with activity level during any parts of the experiment in any of the two experiments.
Responsible for this page:
Director of undergraduate studies Biology
Last updated:
06/05/14