
Spatial heterogeneity of nutrient (N, P and K) balances
The calculations find out:
The areas of nutrient consumption are different to the areas of excretions. Separation is evident from farm level up till country level.
For Sweden, out of 290 the municipalities 102 are source of N, 87 are source of P, while 157 are source of K. The remaining the municipalities are the sinks of those nutrients.
For Pakistan out that out of 111 districts, 63 districts are source of N, 16 are source of P, while 104 are source of K.
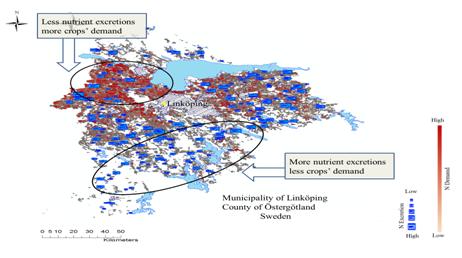
Specialization in nutrient (N) demand or excretion at farm scale in the municipality of Linköping. Red: N demands of crops. Blue: N excretion at cattle farms.
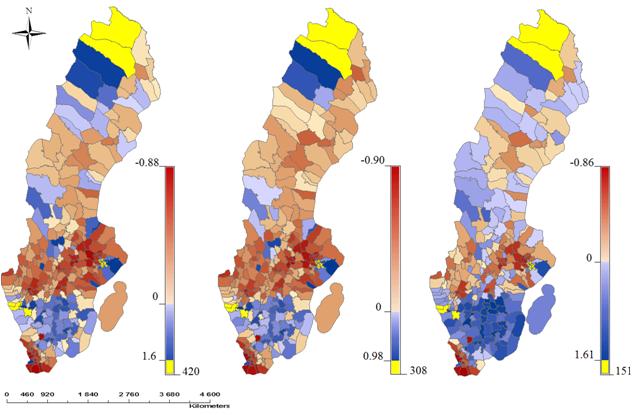
Swedish municipalities: Spatial heterogeneity of nutrient (N, P and K) balances. Blue is extra percentage of their own demands, yellow is exceptionally high excretions, while red is percentage shortage in demand. Left: N. Middle: P. Right: K.
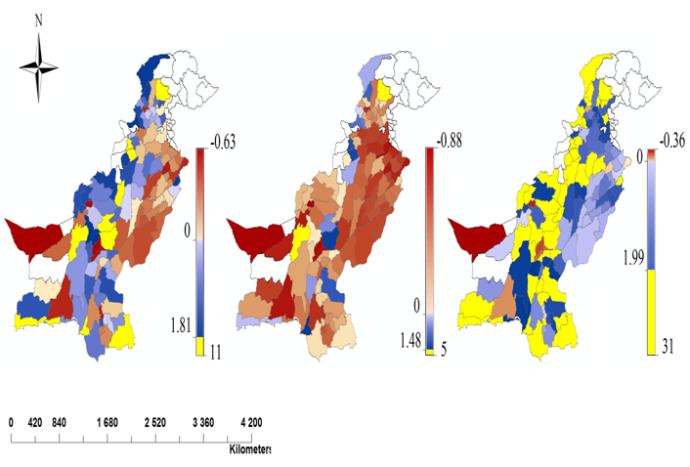
Pakistan districts: Spatial heterogeneity of nutrient (N, P and K) balances. Blue is extra percentage of their own demands, yellow is exceptionally high excretions, while red is percentage shortage in demand. Left: N. Middle: P. Right: K.
Responsible for this page:
Director of undergraduate studies Biology
Last updated:
06/09/14