
Water quality and Greenhouse gas production
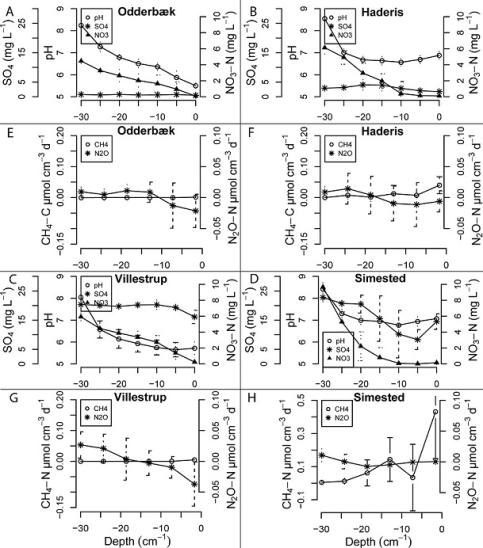
The water quality regarding pH was decreasing for all sites with the depth. Site Simested and Haderis had a stable pH level around 7 compared to Odderbæk and Villestrup with a pH-level at 5.5 and 5.7 representatively in the outlet water.
We found the highest methane (CH4) emission at site Simested followed by Haderis, Villestrup and Odderbæk. It is also possible to see methane produced when nitrate concentration decreased in the figure below. This suggests being due to bacteria, which produce methane, are outcompeted by bacteria which use nitrate for the carbon sources.
The highest nitrous oxide (N2O) emission was found at site Villestrup with low organic matter content in soil. In the figure below can we detect that nitrous oxide produces at lower depth and then reduces in more shallow depths. This suggests to be due to nitrous oxide was used by the bacteria when the nitrate was depleted in shallow depths.
Greenhouse gas production graph
What is illustrated?
The graph a,b,c,d illustrates the groundwater characteristics at each depth from the inlet (-30) to the outlet (0) for the four sites, concerning concentration of nitrate, sulfate and the pH level.
The graph e,f,g,h illustrates the methane (CH4) and nitrous oxide (N2O) production rates, calculated between two depth from inlet (-30) to outlet (0), for the four sites.
Responsible for this page:
Director of undergraduate studies Biology
Last updated:
05/07/12