
Results
Submerged vegetation increased during the season of 2016 and has been re-established in the end of growth season (Unpublished data from Anders Hargeby, 2017).
Precipitation was low during June, July and September, which has influence water levels in L. Tåkern negatively (SMHI, 2017).
In correlation calculations, light absorbance at 420 nm was remove for two sampling days, due to high values that could not be explained (Appendix, table 14).
Seasonal development of zooplankton
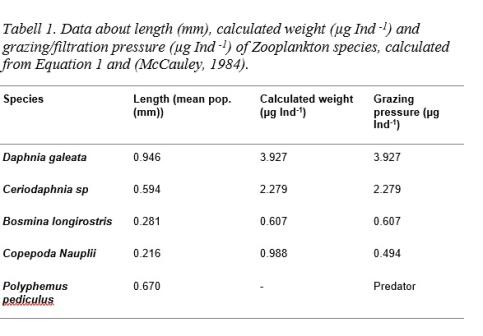
Zooplankton community was periodically individual rich, dominated mainly by Cladocerans Bosmina longirostris and Ceriodaphnia sp (Figure x and x). Juvenile stages of Cyclopoid copepods were periodically higher while Calanoid copepods were completely missing. Density and biomass peaked during May and June (Figure 4). Diversity and individual richness varied noticeably between samplings. Large Daphnias were sparse generally, but during samplings May 6th and May 12th high densities of Daphnia galeata (Figure 4) was measured. High biomasses could be traced to Daphnia galeata. Grazing pressure was calculated after found and measured species according to Dumont et al (1975) (Equation 1) and McCauley (1984) (Table 1). Grazing och filtration pressure varied according to changing levels in density and biomass and peaked in May (Table 2).
Rotatoria community remained relatively stable over the season. Highest densities were measured at end of April and beginning of August. Examples of species was Keratella sp, Polyarthra sp and Synchaeta sp. Density, biomass and diversity varied clearly between the sampling points (Figure 4).
Seasonal development of phytoplankton
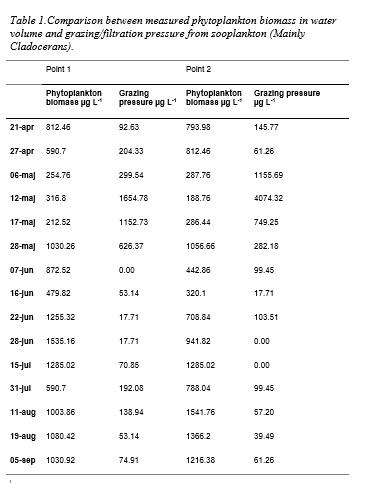
Phytoplankton community characteristics varied between samples. Species diversity was moderate or low. Phytoplankton biomass (+density and chlorophyll a) fluctuated but was occasionally high (Table 2). Phytoplankton biomass differed between test points. From end of June, Cyanobacteria dominanted in both point 1 and 2. In beginning of sampling, Chrysophyta species’ Dinobryon divergens and Bacillariophyte’s Pennales dominated (Figure 5). Phytoplankton biomass declined in correlation to high zooplankton densities (Table 2).
Contributions to suspended solids.
Correlations- Site 1
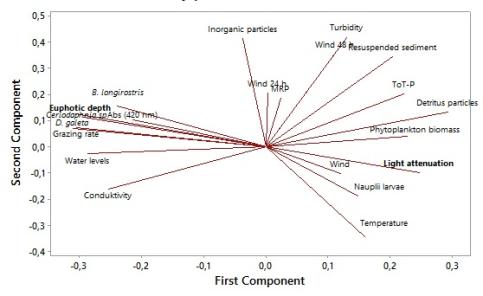
Light attenuation increased significantly with a higher organic content (detritus and phytoplankton biomass) and a lower light attenuation gave a significantly higher conductivity and phytoplankton diversity. Wind velocity showed to significant increase turbidity, absorbance, calculated light attenuation och wavelength (Table 2 and 3). Fetch increased the wavelength significantly. Transparency, light attenuation and calculated light attenuation was correlated with total amount of resuspended material, organic content, phytoplankton density and diversity, velocity, conductivity and temperature (Table 2, 3 and 4).
Turbidity increased significantly with higher phytoplankton density, likewise a higher phytoplankton density gave increased amount of sediment and an increased amount of organic sediment. Transparency decreased significantly with a higher number of phytoplankton (Table 2 and 3).
Grazing pressure was positively correlated with zooplankton density and diversity. It was positively correlated with total biomass of Cladocerans, likewise as biomass of Ceriodaphnia sp, D. galeata and B. longirostris (Table 5). Grazing pressure was positively correlated with detritus material and negatively correlated with chlorophyll a and temperature. Likewise, chlorophyll a levels was negatively correlated with biomass of Ceriodaphnia sp, D. galeata and B. longirostris. (Table 5)
Total biomass of Cladocerans was negatively correlated with temperature and positive with amount of detritus material. Biomass of Daphnia galeata was positively correlated with conductivity and negatively correlated with water temperature, organic content, total phosphorous and light attenuation (Table 5).
Correlations- Site 2
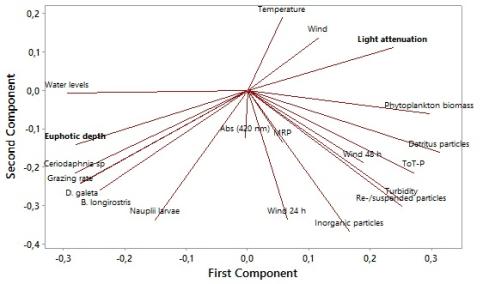
Transparency, light attenuation and calculated light attenuation was correlated with turbidity, chlorophyll a, resuspended sediment, organic content, phytoplankton density and diversity, total phosphorous, velocity, wavelength, conductivity, absorbance and grazing pressure (Table 6, 7, 8).
Higher chlorophyll a levelsshowed to significantly increase turbidity, total amount of resuspended sediment, organic content and light attenuation. Higher total phosphorous levels and phytoplankton density showed to significantly increase chlorophyll a. Lower chlorophyll a levels showed to give significant higher conductivity, transparency, amount of detritus material and phytoplankton diversity. Phytoplankton density showed to significantly increase turbidity, total amount of sediment and organic content. A lower density of phytoplankton gave a significant higher transparency (se chlorophyll a). Lower turbidity, chlorophyll a, total phosphorous, total amount of resuspended sediment and organic content gave a significant higher phytoplankton diversity. Turbidity was correlated with chlorophyll a, total amount of resuspended sediment, organic content, phytoplankton density and diversity, total phosphorous, light attenuation, velocity, transparency and conductivity, (Table 6, 7, 8).
Grazing pressure was positivity correlated with total biomass of Cladocerans and biomass of Ceriodaphnia sp, D. galeata and B. longirostris. Grazing pressure was negatively correlated with chlorophyll a, organic content, light attenuation and total phosphorous (Table 9). Grazing pressure was not affected by turbidity, transparency or calculated light attenuation (Table 8).
Biomass of Ceriodaphnia sp and D. galeata was negatively correlated with turbidity, chlorophyll a, phytoplankton density, total phosphorous and light attenuation. Biomass of Ceriodaphnia sp was negatively correlated with total amount of resuspended sediment and velocity (m S-1) 48 h before sampling. Biomass of D. galeata was negatively correlated with wavelength (m). Biomass of B. longirostris was negatively correlated with water temperature and velocity (Table 9).
Biomass of D. galeata was positively correlated with transparency (cm) and biomass of Copepoda Nauplii was positively correlated with inorganic content and bioavailable phosphorous (Table 9).
Responsible for this page:
Director of undergraduate studies Biology
Last updated:
05/28/17